

If this is happening in the U.K., why would you think it’s not happening here as well?
Hyping the Covid Burden on Hospitals.
A Doctor Writes: The NHS Is Concealing Important Information from the Public
On Thursdays, the NHS release the weekly summary data in relation to Covid patients. Normally this is a more granular version of the daily summaries – it has some hospital level detail and figures on non-Covid workload for comparison. Usually interesting but not especially informative.
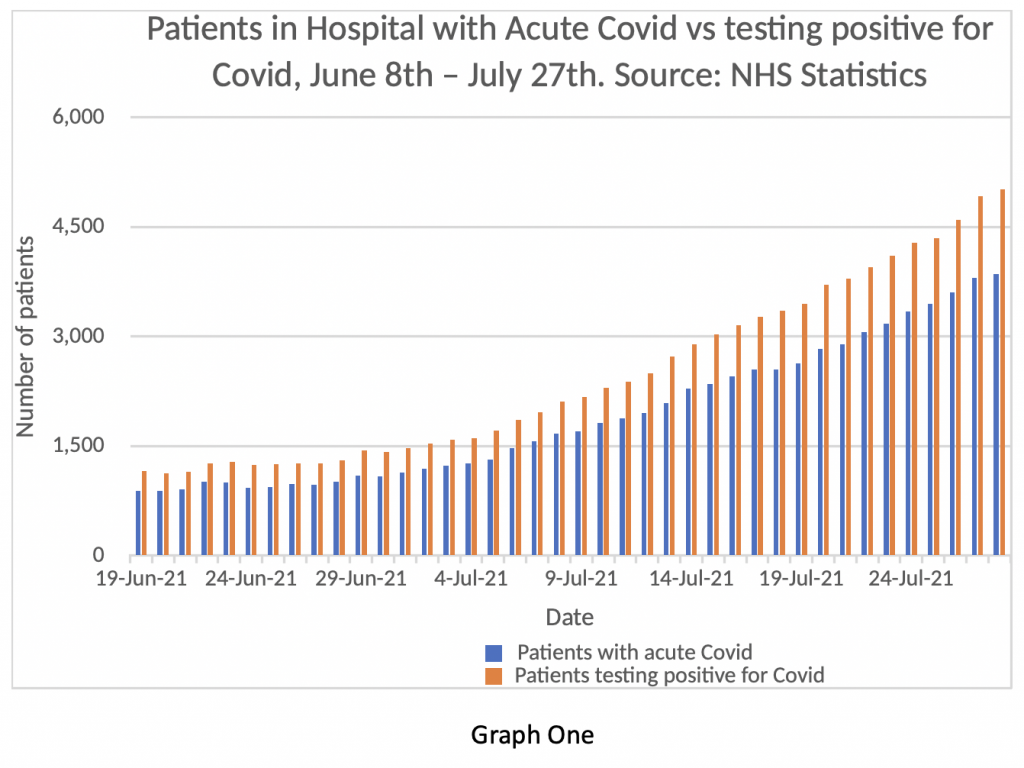
Yesterday was an exception. Placed down at the bottom of the page, almost like a footnote, was a “Primary Diagnosis” Supplement. Graph One shows the information contained in that spreadsheet. I find it astonishing. In essence, it shows that since June 18th, the NHS has known its daily figures in relation to ‘Covid inpatients’ were unreliable at best and deliberately untrue at worst.
The Yellow bars are what the NHS has been informing the nation were Covid inpatients. The Blue bars are the numbers of inpatients actually suffering from Covid symptoms – the difference between the two are patients in hospital who tested positive for Covid but were being treated for something different – where Covid was effectively an incidental finding but not clinically relevant.
For example, on July 27th, the total number of beds occupied by Covid patients was reported as 5,021. However, until today, we were not permitted to know that only 3,855 of those were actually admitted with Covid as the primary diagnosis. There has been a fairly consistent overestimate of the true number by about 25% running back to mid June – figures before that date are ‘not available’.
Why does this matter?
Well in one way it doesn’t matter very much. Whether the burden of Covid inpatients is 5% of the available beds or 3.5%, isn’t massively significant – it’s still a relatively small proportion. NHS managers are already arguing that even patients with Covid being treated for another condition still need isolation procedures and present an extra burden on the system. They may argue that the NHS is still under strain from staff absences, stress levels and the waiting list backlog – so it doesn’t really matter if the published figures are somewhat inaccurate.
But it matters hugely.
Firstly, it clearly shows that the NHS has been exaggerating the burden of Covid on hospitals by 25% since at least the June 18th and almost certainly for longer. All the senior NHS leaders and politicians quoting the number of Covid inpatients for the last six weeks have been painting a seriously exaggerated picture, significantly worse than the true position. Were they in ignorance about the true numbers, or were they deliberately misleading the public?
The question also arises whether Government ministers have been given the same inaccurate information, or whether they too knew the information was exaggerated. This goes to the heart of how important decisions are made in the U.K. If ministers are being provided with incorrect information, they will make poor decisions. Have the NHS been deliberately ‘filtering’ information passed to ministers with the intention of influencing important decisions and maintaining restrictions on the public?
On the other hand, if the decision-makers were aware that the published figures were false and that the true picture is significantly better, why have they been so slow to open up and so ready to talk up the threat? Hospital inpatient numbers and the burden on ‘our NHS’ have been used for months to justify maintaining societal restrictions, vaccine passports, excessive and expensive testing for foreign travel and an unprecedented curtailment of civil liberties in the U.K. Have ministers been aware all this time, that the true picture was far less of a ‘threat’ than they have publicly stated? I think the public need answers to these questions from our elected representatives – and directly honest ones rather than the usual obfuscation and circumlocution.
On July 12th, Mark Harper MP asked Sajid Javid in the House of Commons whether the information being published about Covid inpatients was accurate. The question was captured on the Parliamentary TV channel. Javid replied to the effect that the information may not be strictly accurate and he had asked for clarification from the Department of Health on these points. If these new figures are true, we now know the extent of the inaccuracy.
Of course, many readers will have long questioned the validity of the official data. I myself have found it difficult to reconcile the admissions from the community numbers, compared with the monthly discharge figures set against the ever-increasing numbers of ‘Covid inpatients’. The figures just didn’t make sense – now I know why.
In previous posts, I have preferred to look at daily admissions from the community, rather than the figures for patients diagnosed in hospital, based on my suspicion that the data was manipulated. As readers will know, the number of positive tests in the community has been falling for the last week. Graph Two shows daily admissions to hospitals from the community on the blue bars and the three-day rolling average on the orange line.
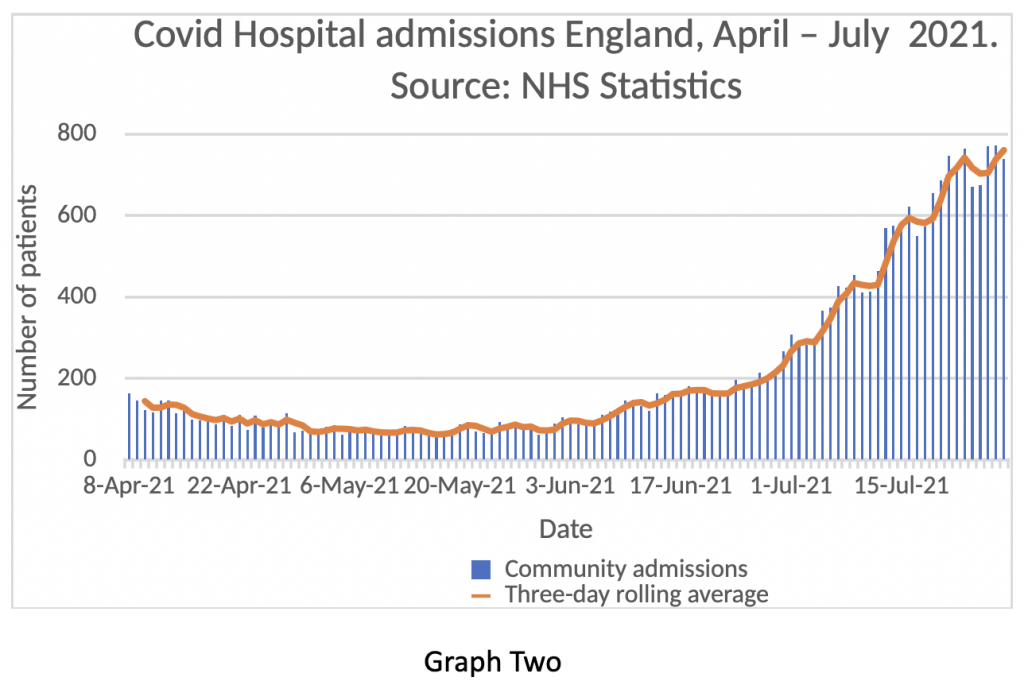
The rate of admissions seems to be levelling off – readers should remember that admissions usually lag positive community tests by 10 days or so. This is an early finding and may well prove to be a false indicator, but at the moment it is changing consistently with falling test numbers. The next week will be important in assessing whether admissions will mirror tests and start to fall. It is entirely reasonable for readers to question whether these figures are also exaggerated – I wonder that myself. Nevertheless, it is the trend rather than the absolute value that is the important issue, so I do think this dataset has utility. Fewer positive tests in the community should filter through to fewer positive tests on admission – even for patients admitted for other primary diagnoses, so it should be a fair reflection of the amount of virus there is prevalent in the U.K.
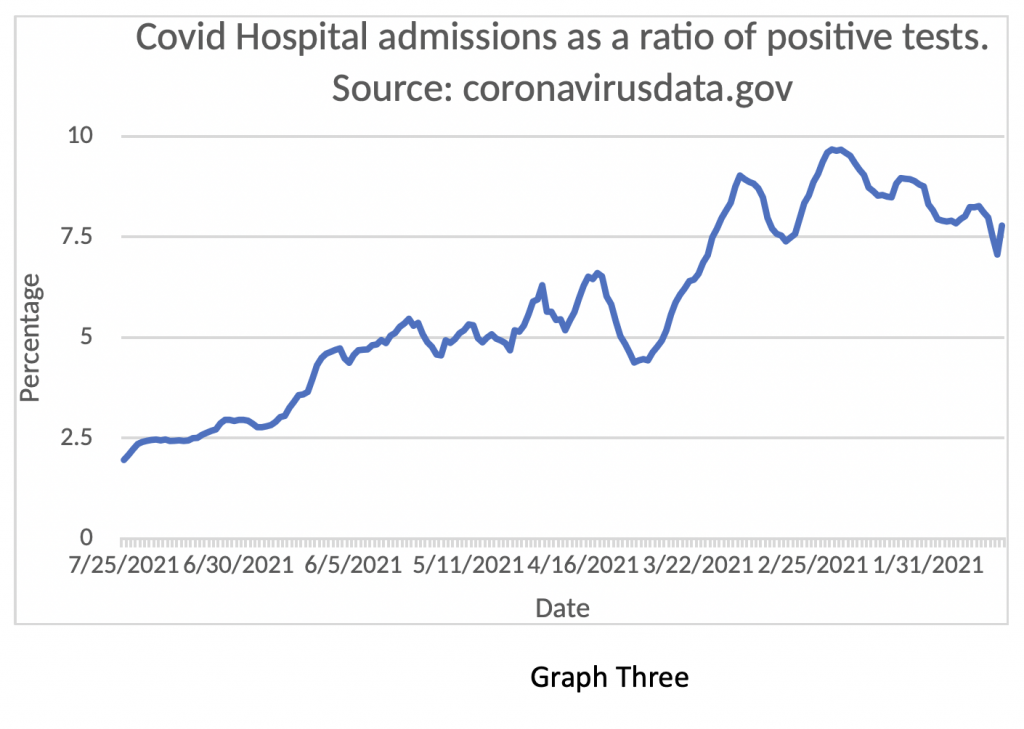
Supporting this finding is Graph Three. showing the fall in Admissions in relation to positive tests – in February, about 10% of people testing positive ended up in hospital. Now only 2% do – in essence, Graph Three shows that the risk of someone ending up in hospital with Covid has fallen by 80% from the peak number in February.
As with in-hospital infection rates, the NHS has once again been caught out concealing important information from the public. I find that truly shocking, but not surprising – in some ways I’m actually more surprised they have admitted it!
My suspicion is that the new health secretary and the newly appointed CEO of the NHS have been keen to get the true figures in the public domain at the start of their tenure, knowing that it would come out eventually. In business, this is called ‘kitchen sinking’ – where a new CEO gets all the bad news out early with the hope of blaming one’s predecessor and establishing a fresh start.
Nevertheless, Amanda Pritchard, appointed this week as the successor to Simon Stevens, has been the Chief Operating Officer of the NHS for nearly two years – is it possible that she has been unaware of the deception until very recently and suddenly undergone a Damascene conversion to the cause of transparency?
What this issue really goes to however is the factor at the heart of any doctor-patient interaction. The concept of Trust. I can’t overstate how important trust is in clinical medicine. The managers of the NHS expect clinicians to practice a ‘duty of candour’ when interacting with the public. It seems they don’t consider themselves to be under the same obligation. A curious parallel with recent ‘double standards’ from our politicians.
NHS managers at the highest level have repeatedly been caught out concealing important information or distorting published data. They did it with in-hospital infection rates, with reported death figures and now with hospital inpatient numbers. Viewed in a generous light this could be attributed to serial incompetence rather than deliberate deception. However, there is a pattern of behaviour here: concealment, denial, cover-up; trashing and vilification of people questioning the official narrative; followed by reluctant forced admission, spurious post hoc justification, dismissal of criticism and an appeal to the public to trust the NHS.
Our political and health care leaders may be about to discover that trust is a fragile commodity – and it’s running out fast.