
Updated information on Mass Public Shootings from 1998 through October 2023

Between January 1st, 1998, and October 25th, 2023, 52.5% of attacks used solely handguns, and 16.8% used only rifles of any type—thirty-five percent of attacks used solely rifles or rifles in conjunction with another type of gun. Given the debate over pistol-stabilizing braces, the Excel file we provide lists the guns used in each attack, and two of the attacks used AR-15-type handguns with a pistol-stabilizing brace.
59.3% of the US population was non-Hispanic white in 2022, with 4% being Middle Eastern, so about 55.3% are non-Middle Eastern whites. With 55% of the murderers and victims being non-Middle Eastern whites, whites are slightly below their share of those involved in these attacks.
With all the discussions about the racial motives of shooters, blacks are underrepresented as a share of the victims. Blacks comprise 16.7% of the murderers but only 9.9% of the victims. That 9.9% is less than their 13.6% of the general population.
Hispanics are underrepresented as a share of mass murderers. 10.8% of these mass murderers are Hispanic compared to Hispanics, making up 18.9% of the general population. But their 17.1% share of the victims is close to Hispanics’ share of the general population.
Compared to Middle Easterners at 4% of the general population, they are overrepresented as a share of mass murderers (6.9%) and underrepresented in terms of victims (0.9%).
Asians make up 6.1% of the population, but they are overrepresented in both mass murderers (7.8%) and even more overrepresented as victims (9.7%). Interestingly, 44% of the Asians murdered in these attacks were murdered by other Asians.
From January 1st, 1998, to October 25th, 2023, 51% of mass murderers have seen mental health care professionals before their attacks.
In 2022, about 6% of the US were veterans, but almost 20% of mass public shooters were veterans.
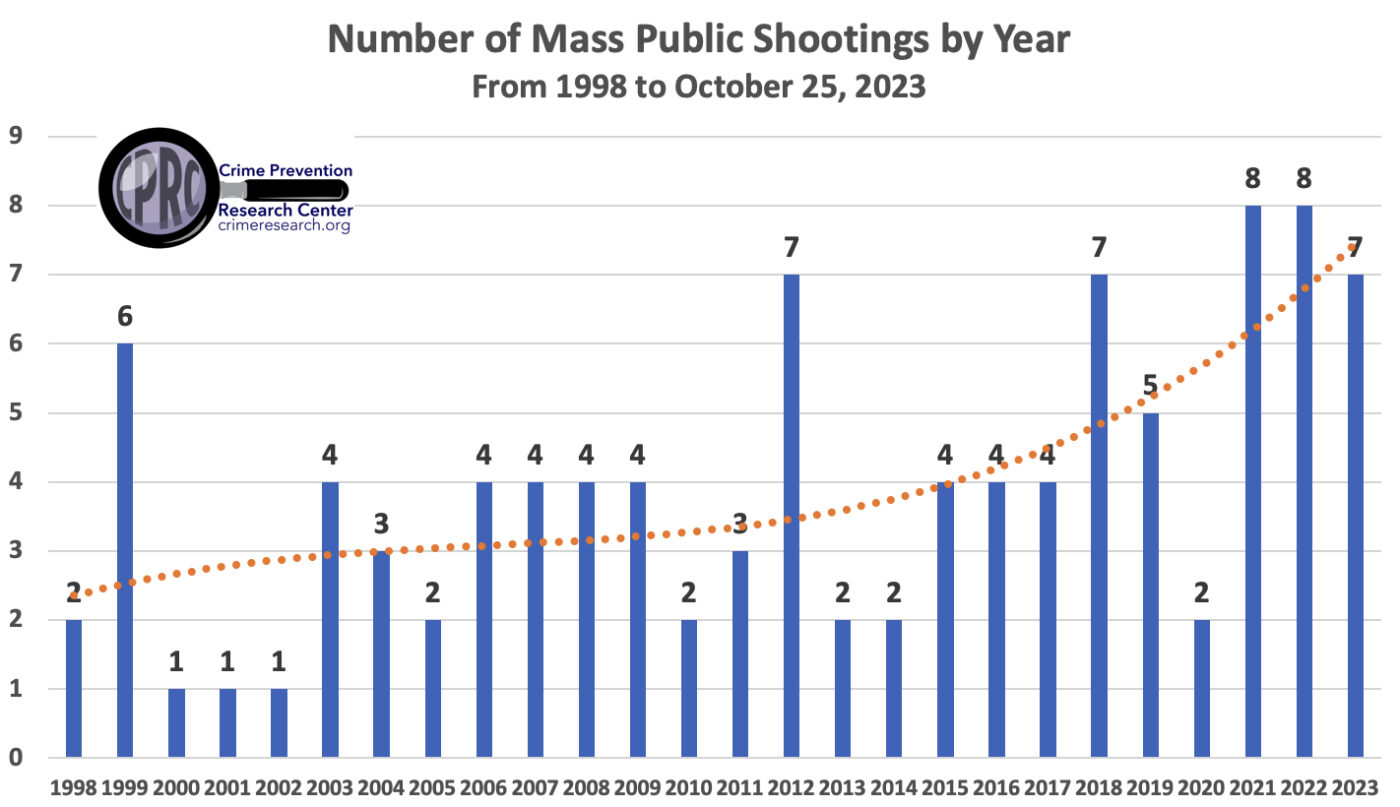
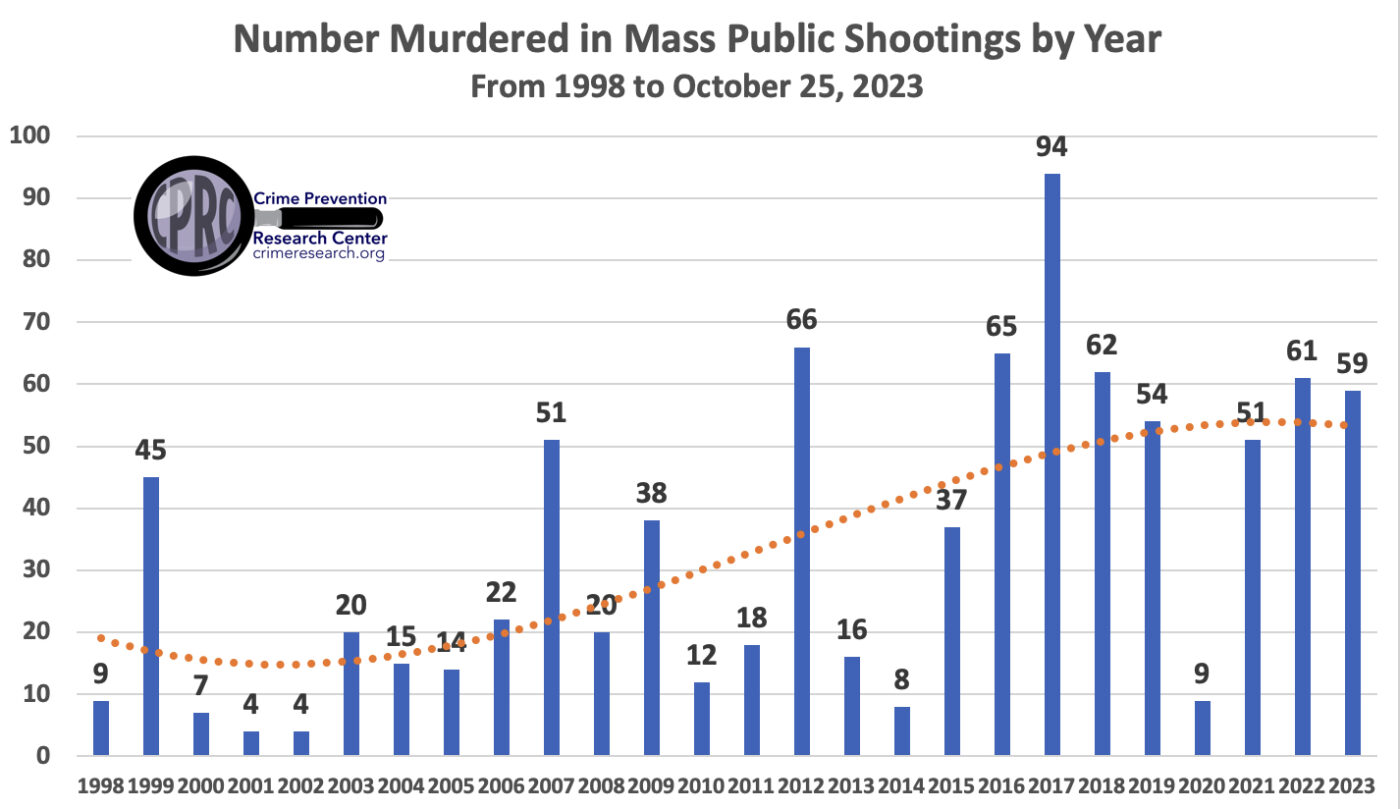
Between 1998 and 2023 the number of mass public shootings averaged 3.9 attacks, 33.1 murdered per year, and the number murdered per attack was 7.9. The number of attacks is increasing at an increasing rate, while the number of people murdered and the number murdered per attack was declining. In five year intervals, the number of mass public shootings varied this way: 2.6 (1999-2003), 3.4 (2004-2008), 3.6 (2009-2013), 4.2 (2014-2018), and 6.0 (2019-2023). In five year intervals, the number of people murdered in mass public shootings varied this way: 16 (1999-2003), 24.4 (2004-2008), 30 (2009-2013), 53.2 (2014-2018), and 46.8 (2019-2023).
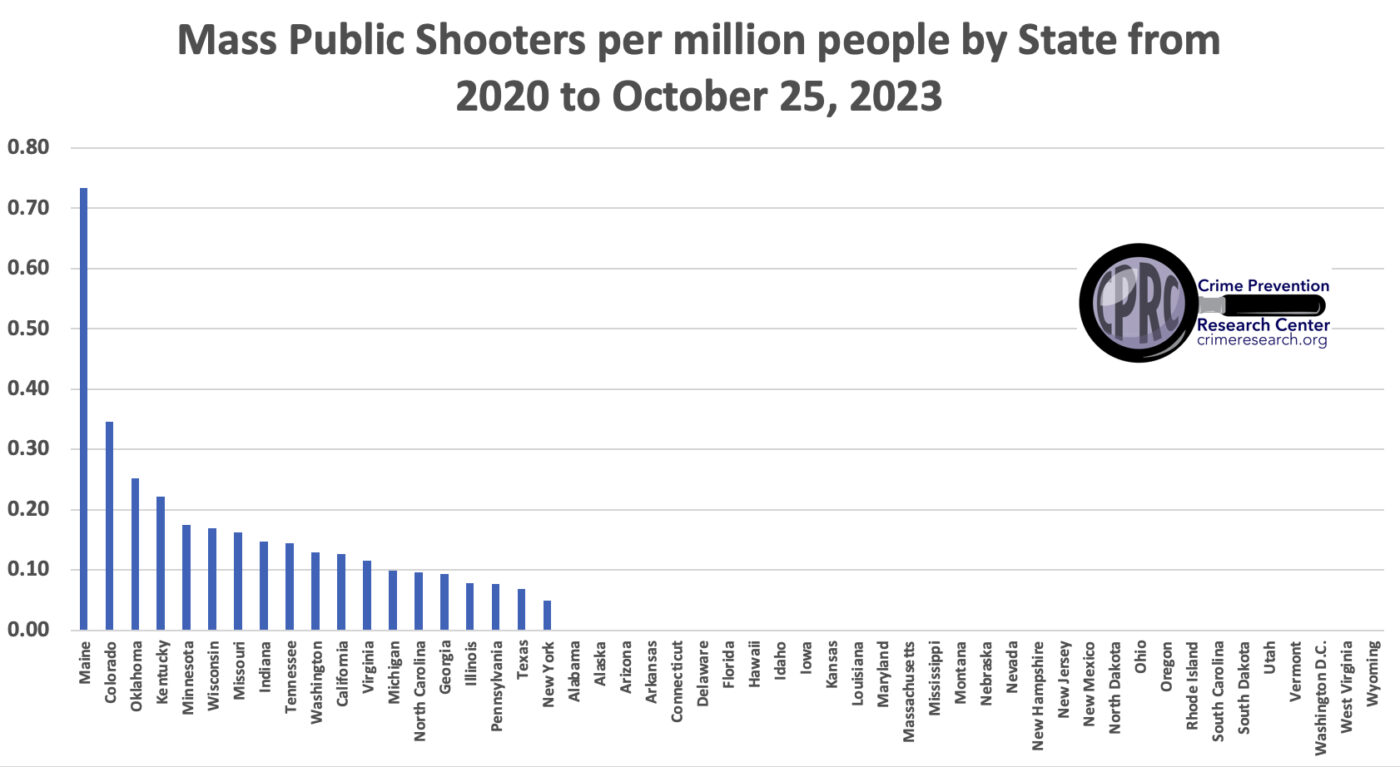
The final set of figures shows how California’s per capita rate of Mass Public Shootings is much higher than the rate for the rest of the country. Since 2000, California’s rate is 0.33 per million, and for the rest of the US it was 0.25. Since 2010, California’s rate is 0.28 per million and 0.15 for the rest of the US. Since 2020, it has been 0.13 for California and 0.05 for the rest of the US.